


Three formats, one question, a lot of confusion
Years ago, in a hotel bar in Brisbane the night before a Wallabies test, I watched a sharp British punter and an equally sharp American punter argue for forty minutes about whether 2.10 was a better price than +110. They were the same price. Neither of them realised it for the entire argument. They eventually called a truce and split a bottle of wine, and I made a note to myself: the formats are a tax on inattention.
The global sports betting market has grown from $119.26 billion in 2025 to $125.12 billion in 2026, and that money is split across three odds formats that look different but say exactly the same thing about probability. If you bet rugby seriously, you’ll meet all three — decimal in the UK and Europe outside the high street, fractional on the British high street and most racing-led traditions, American across the United States and Canada. Knowing them isn’t optional. Treating them as interchangeable expressions of the same maths is the difference between reading a price and being read by one.
This guide is the unglamorous half of rugby betting. No predictions, no value calls, no team-by-team breakdowns. Just the arithmetic that sits underneath every price on every screen, the bookmaker margin baked into it, and the discipline that separates people who understand what they’re being charged from people who pay it and don’t notice.
The three odds formats and what they actually tell you
The simplest way I’ve found to teach this is to write the same bet out three times. Imagine a Six Nations fixture where the favourite is priced to give you back £2.10 for every £1 staked, including the stake itself. In decimal that’s 2.10. In fractional that’s 11/10. In American odds that’s +110. The same bet, the same return, three notations. Decide which one you find readable, learn to convert the other two on sight, and you’ve solved 90% of the format problem in rugby betting.
Decimal odds tell you the total return on a winning £1 stake — stake included. A price of 2.50 returns £2.50 on a £1 win: £1.50 profit, plus the £1 you staked. Multiply the stake by the decimal price and you have your return. It’s the format every spreadsheet model defaults to, and the format you’ll see on every European-facing sportsbook. Decimals also handle short prices honestly. A 1.10 favourite returns ten pence on the pound. Easy to scan, easy to compare, hard to misread.
Fractional odds tell you the profit on the stake — stake not included. 11/10 means you win £11 profit on every £10 staked, so a £10 bet pays £21 back (£11 profit + £10 stake). The format comes from racing and survives in British rugby betting partly out of tradition and partly because some punters genuinely find it intuitive. The trouble is short prices: 1/2 means a £2 bet returns £3, which feels less natural than the decimal 1.50. And the conversion to implied probability takes an extra step. If you grew up with fractionals, they’re fine. If you didn’t, switch your sportsbook display to decimal and never look back.
American odds quote either a positive number (underdog) or a negative number (favourite), with 100 as the reference point. +150 means a $100 stake wins $150 profit. -150 means you must stake $150 to win $100 profit. The format pivots at +100/-100, which is the American notation for an even bet. The pivot is where new users get confused: -110 (the standard handicap line in US sportsbooks) means you stake $110 to win $100, an implied probability of about 52.4%. Once the pivot makes sense, the format is workable. Until then, every American-style sportsbook screen feels like a maths puzzle written by someone who doesn’t want you to solve it.
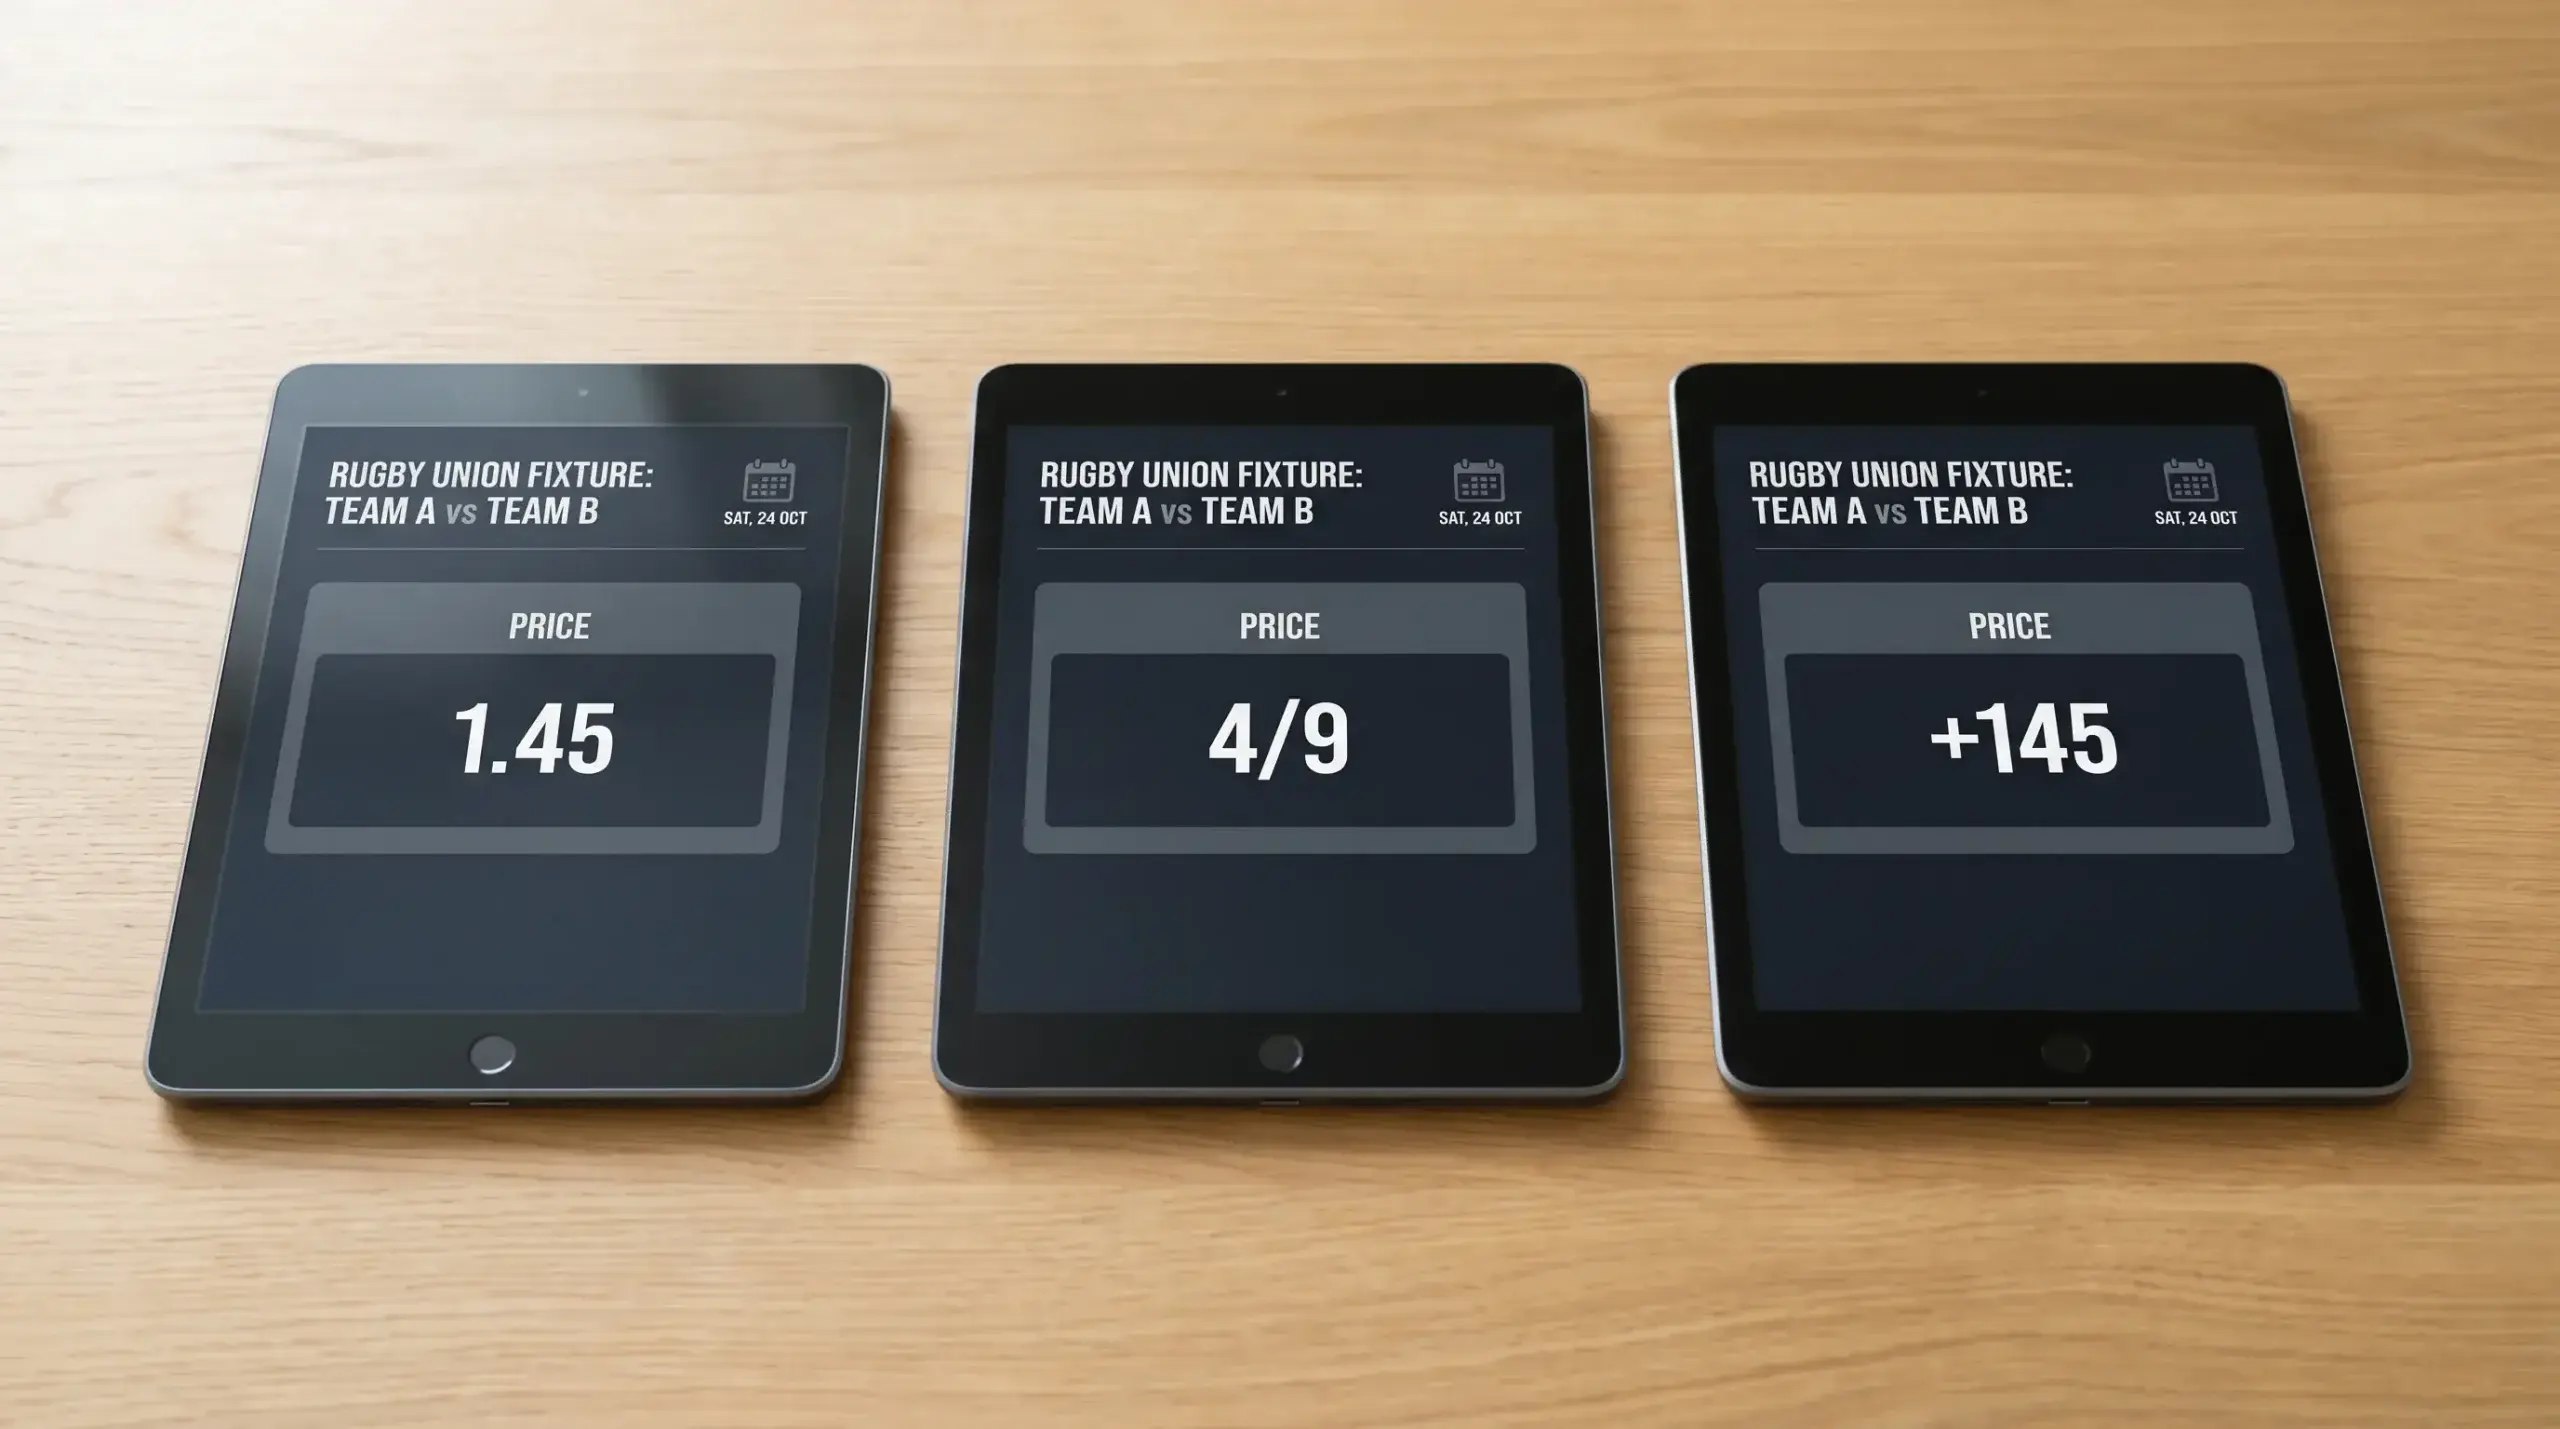
The conversion that matters most isn’t between formats — it’s from any format into implied probability. That’s where the actual analysis lives.
Implied probability and the only equation that matters
If you take one thing from this guide, take this: implied probability equals 1 divided by the decimal price. A decimal price of 2.00 implies a 50% probability. A decimal price of 4.00 implies a 25% probability. A decimal price of 1.25 implies an 80% probability. That’s it. That’s the equation. Memorise it, use it on every price you see, and you’ll do more useful work than 90% of recreational bettors do in a season.
The reason this matters is that the price the sportsbook quotes is not the true probability of the outcome. The price is the bookmaker’s quote inclusive of their margin. If England are quoted at 1.25 against Italy at Twickenham, the book is telling you their implied probability is 80%. The actual probability — the “true” price stripped of margin — is something like 81% or 82%, slightly higher than the quoted implied. When you compare your own probability estimate to the market, you compare it to the quoted implied, not to some abstract truth. The implied is the number you negotiate with.
For fractional odds, the conversion is denominator divided by the sum of numerator and denominator. 11/10 becomes 10 divided by (11 + 10) = 47.6%. For American positive odds, it’s 100 divided by (odds + 100). +150 becomes 100/250 = 40%. For American negative odds, it’s the absolute value of the odds divided by (absolute value + 100). -150 becomes 150/250 = 60%. The arithmetic isn’t difficult; the difficulty is doing it on the fly while a sportsbook screen flashes new prices at you. The discipline I teach anyone serious about rugby betting is this: never stake on a price you haven’t converted to implied probability in your head first.

The implied probability is also how you compare prices across sportsbooks. If one operator has the favourite at 1.50 and another has them at 1.55, the implied probabilities are 66.7% and 64.5%. That 2.2 percentage point gap is real money over a season. It’s the foundation of line shopping, which I’ll come to in a moment. But none of it works without the implied probability conversion, so make it a reflex.
Overround, vig and the bookmaker margin you pay every time
If you add up the implied probabilities of every outcome in a betting market, you should get 100%. You won’t. You’ll get something between 102% and 115%, depending on the market and the operator. That extra is the bookmaker’s margin — known as the overround in the UK, the vig or juice in the US, the take in Australia. It’s the price of doing business and it’s the thing that grinds down winning bettors over time as effectively as any losing run.
Take a Six Nations handicap with two outcomes — favourite to cover, underdog to cover. If both sides are priced at 1.91, the implied probabilities are 52.4% and 52.4%, summing to 104.8%. That 4.8% over 100% is the overround. On a two-way market that’s a tight, healthy margin. On a three-way moneyline in the same fixture you might see 105% to 108% overround. On a winning-margin market with eight or nine outcome bands, you’ll see 110% to 115%. On a first try scorer market with twenty-plus selections, 130% to 150% is typical.
The overround compounds. If you bet a 105% market and you have zero edge — you’re guessing — you lose 5% of every stake to the book over the long run. Bet ten 105% markets in a row in a parlay and you compound that 5% into something genuinely brutal. The reason accumulator bets feel exciting and pay so badly over a season is that the overround stacks multiplicatively across each leg, and most punters never do the arithmetic.
How do you devig — strip the overround out of a quoted price to find the implied true probability? The simplest method is to divide each outcome’s implied probability by the total of all implied probabilities in the market. If the favourite is at 1.50 (66.7% implied) and the underdog is at 2.80 (35.7% implied), the total is 102.4%. The devigged probabilities are 66.7/102.4 = 65.1% for the favourite and 35.7/102.4 = 34.9% for the underdog. That’s the market’s actual estimate of the matchup, before margin. Compare your own estimate to that devigged number, not to the headline price.
This is the maths that separates serious bettors from passive ones. Online gross gambling yield in the UK reached £1.54 billion in the quarter ending December 2024, up 21% year on year, and a huge share of that growth came from real-event betting. More money flowing into rugby markets doesn’t reduce the overround on first try scorer. It does, however, gradually tighten the overround on two-way head-to-head markets, which is why the cleanest expression of any rugby opinion is the lowest-overround market you can find.
How bookmakers actually price a rugby match
I’ll let you in on something most punters never think about: the price you see in the morning of a fixture isn’t set by a human. AI algorithms now price the opening lines on more than 55% of sportsbook platforms, and the proportion is climbing. The opening line is a model output, calibrated against historical results, recent form, public-facing power ratings, and the operator’s own internal liability map. Humans intervene later — to react to team news, to large bets, to weather updates — but the first number on the screen is increasingly machine-generated.
For a Six Nations or NRL fixture, the model starts with a power rating differential. Each team has a rating, the difference between the ratings produces an expected margin, and the expected margin maps to a handicap line. Convert that handicap to a moneyline using a logistic or Poisson-based scoring distribution, attach the overround, and you have the opening price. The whole process takes seconds. A pricing team then layers in factors the model can’t easily quantify — travel, motivation, weather forecasts beyond a 36-hour horizon, refereeing assignments — and that’s how the line you see at 9am Saturday emerges.
What follows is the part most bettors do see: the line moves. A starting fly-half is ruled out, the favourite drifts. Sharp money lands on the underdog, the line moves to balance liability. Twenty minutes before kick-off, the betting closes briefly while the operator squares its book, and then re-opens for in-play. The closing line — the last price before the match starts — is the price most respected by professional bettors, because by then every piece of information available has been priced in. Beating the closing line is the metric professionals use to judge their own results.

Chad Yeomans, who handles communications at Betway, summed up one notable Cheltenham this year by saying — half-jokingly, but truthfully — that for bookmakers it was a Cheltenham to remember, that it’s very rare so many well-fancied shots get beaten, and that there was definitely no moaning from the bookmakers’ side. That’s the daily reality on every rugby weekend too. The market’s job is to make every outcome roughly equally unattractive to the operator. When it works, the book is indifferent to which side wins. When it fails — when too much money piles on one side — the line moves until indifference is restored.
The takeaway for you as a bettor: you’re not pricing against a human’s opinion. You’re pricing against a model, plus a layer of human judgement, plus the cumulative weight of every other bettor’s stake on the same market. That’s a deep pool to swim in. The way you compete is by reading the market itself, which is exactly what line shopping does.
Line shopping, the unglamorous edge that compounds
If you do nothing else from this guide, do this. Open accounts with at least three sportsbooks. Before every bet, check the same selection at each operator. Take the best available price. That’s line shopping, and over a season of rugby betting it’s worth more than 90% of the strategic analysis people post on betting Twitter.
Here’s the maths. Across the major UK sportsbooks, the average difference between the best and the second-best price on a Six Nations moneyline is between 0.05 and 0.10 in decimal terms — sometimes more, on smaller markets or at unusual times of day. The largest UK operators reported an average of 12.7 million active monthly accounts in the first quarter of 2025/26, which means the market is liquid and the price differences are stable rather than random. If you take a 2.00 price at one book when another has 2.05, you’ve added 2.5% to every winning return on that side of the bet. Compound that over 200 bets a season and you’re meaningfully ahead of someone using the same selections at one operator.
The practical workflow: I have four operators bookmarked, all on the same browser tab group. Before any rugby bet, I open all four and check the line. The whole process takes 30 seconds. In rugby specifically, the lines diverge most on bonus-point markets, winning margin, and player props, because those markets have lower liquidity and the operators trade them more independently. Moneylines on big Six Nations fixtures tend to converge tightly within an hour of opening, but the satellite markets stay loose all morning.

One trap to avoid: don’t open ten accounts and chase every available price. That’s a recipe for admin overhead and bonus-hunting habits that genuinely do annoy operators. Three to five well-chosen sportsbooks, one of which is a market-leader for price quality, is the sweet spot. The point isn’t to maximise the number of prices on screen. It’s to ensure you never take a worse price than necessary on a market you’ve already decided to bet.
Value, expected value and the discipline of saying no
The word “value” is so overused in betting content that I almost dislike using it. But it has a specific, useful meaning. A bet has positive expected value when your estimate of the outcome’s probability is higher than the implied probability of the quoted price. If you think the favourite wins 70% of the time and the price implies 65%, the bet has positive expected value. If you think they win 65% and the price implies 70%, the bet has negative expected value and you skip it.
Expected value as a formula: (your probability estimate × decimal odds) minus 1, expressed as a percentage. If you think a side wins 60% of the time at a price of 1.90, the calculation is (0.60 × 1.90) − 1 = 0.14, or +14% expected value per unit staked. If the price drops to 1.70, the calculation becomes (0.60 × 1.70) − 1 = 0.02, or +2%, which is barely above the bookmaker margin and probably not worth the variance.
The discipline part is harder than the maths. Value betting requires you to skip the majority of available bets, including matches you’ve watched and have opinions on, because the price doesn’t justify the opinion. I sit out roughly four out of every five Premiership fixtures I watch, not because I don’t have a view but because my view is too close to the market’s view to justify a stake. The temptation to bet anyway — to “have skin in the game” — is the temptation that funds the sportsbook industry. The professionals don’t have it. They have the opposite reflex: when a price doesn’t offer positive EV, they walk past it without a backward glance.

I cover the practical side of building a probability model and applying value detection in more depth in the rugby value betting strategy piece. The short version: your probability estimates are noisy, the market’s are less noisy than you think, and your edge will live in narrow, specific situations rather than across the whole fixture list. Accept that early and value betting becomes a calmer, more selective activity.
Closing line value, the metric that predicts long-run results
If expected value is the metric you use to decide on individual bets, closing line value is the metric you use to judge your own track record. Take a bet at 2.10. Watch the line close at 1.95. You’ve beaten the closing line by roughly 7.5%. Do that consistently over hundreds of bets and you have, in the language of the trade, positive CLV. Negative CLV — taking prices that systematically drift longer between your bet and kick-off — predicts long-run losses regardless of any short-run results you produce.
The reason CLV matters is that it strips luck out of your evaluation. Over fifty bets, a profitable bettor can lose money and an unprofitable one can win it. Variance is enormous in rugby because sample sizes are small and individual matches swing on a single penalty kick or red card. CLV doesn’t care about results. It cares about whether the price you took was systematically better than the market’s final price. If the answer is yes, you’ll win in the long run. If it’s no, you’ll lose, even on the weeks when the wins arrive.
Tracking your CLV is straightforward but tedious. Every time you place a bet, record the price you took. Note the kick-off time. Check the closing price at any reputable operator at kick-off and record that. Compute the percentage difference: (your price ÷ closing price) − 1, where positive means you beat the close. After 50 bets you’ll have a noisy estimate. After 200 you’ll have something meaningful. After 500 you’ll know whether you’re really a winning bettor or a lucky one.

The other use of CLV is as a feedback signal for your own model. If your model regularly produces selections that close at longer prices than the ones you took, you’re either betting too early or your model has a systematic bias toward outcomes the market gradually downgrades. Either way, the CLV diagnoses the problem before the bankroll does. Most recreational bettors never measure CLV at all, which is one of the reasons they never improve. The few who measure it improve fast, because the metric gives unambiguous feedback in a sport where genuine signal is rare.
What the formats really teach you about prices
I started this piece in a Brisbane hotel bar with two sharp punters who didn’t realise they agreed with each other for forty minutes. The reason they didn’t realise is the same reason most rugby bettors leak money to the bookmaker: they read the format on the screen and stop there. The decimal, the fractional, the American — they’re notation. The implied probability is the price. The overround is the cost. The closing line is the verdict. Beat the verdict over a sample big enough to matter, and you’ve solved the only problem in betting that’s actually worth solving.
The rest — the team news, the weather, the in-play feel, the bonus-point reads — is what makes the sport interesting. None of it earns you a penny if you can’t read the price underneath it. So: practise the conversions until they’re reflexive. Devig every market before you stake on it. Shop the line at three operators every time. Track your CLV. Skip four out of every five bets you’re tempted by. That’s not the romantic version of rugby betting. It’s the version that survives the season.
