

The market that catches most punters off guard
I had a friend who insisted he was a value player. He bet only NRL props — first try scorer, anytime try scorer, run metres over and under. Every weekend he placed twenty bets. After three years, he was down eighteen percent on turnover. The problem was not his rugby knowledge. The problem was that he had been backing the highest-margin markets on the bookmaker’s board for three years without realising it.
NRL total revenue in 2025 hit AUD 845.6 million, of which AUD 520 million came from licensing — a category that includes commercial relationships with sportsbooks. The volume of NRL prop money flowing through Australian operators is enormous, and the prop board is where the operators make most of that money back. Understanding why is the first step toward betting it intelligently.
Try scorer markets
Try scorer markets are the most popular NRL props by ticket count and the highest-margin markets by built-in overround. A typical anytime try scorer market on a Saturday night Premiership match carries an overround of 30-40%, compared to 4-6% on the headline moneyline. That gap is not subtle. It is the cost of betting on individual players in a chaotic ball sport.

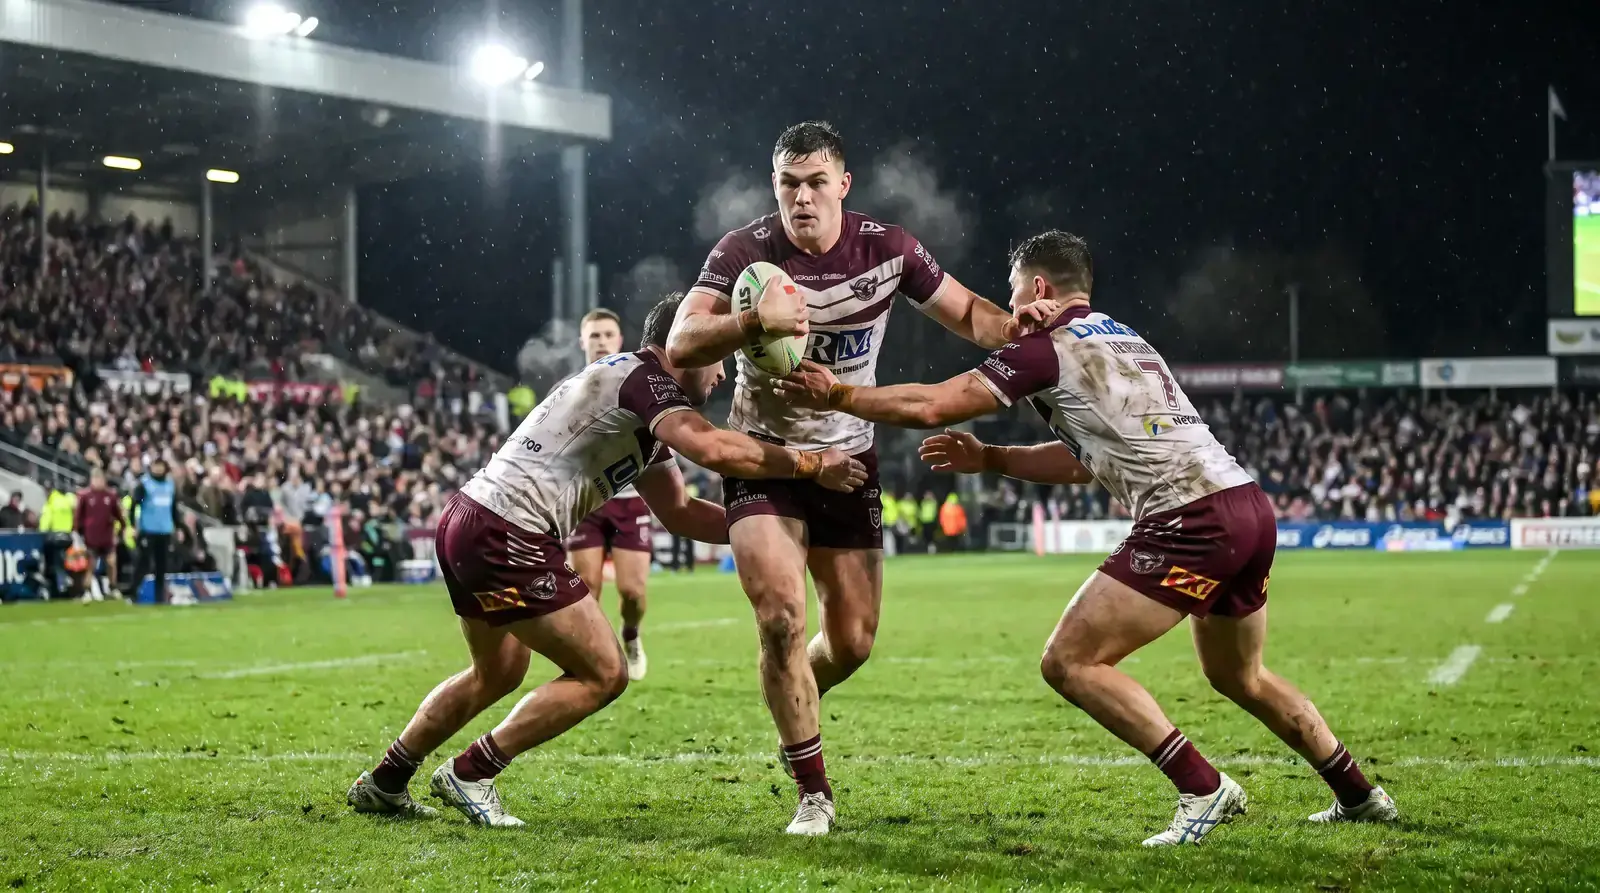
Position drives nearly everything in try scorer markets. Wingers and centres score the bulk of NRL tries because they are at the end of the ball-shifting chain that the structure of the game produces. Fullbacks score fewer than people remember because their primary scoring threat is the chase-and-finish from kicks rather than the structured backline strike. Forwards score occasionally and at long prices, which makes them lottery tickets rather than bets.
The trap with first try scorer specifically is that the market prices it as if the first try is equally likely to be scored by any player on the field. It is not. The opening minutes of an NRL match are dominated by territorial kicks and structured forward play; the first try, when it comes, disproportionately involves either an early backline strike or a forward crossing from close range after sustained pressure. That distribution skew is not properly priced into casual-friendly first try scorer markets.
Run metres and line breaks
Run metres are the prop market where I have personally found the most reliable edge. Bookmakers set run metre lines using a player’s recent average — typically a four to six match rolling window. That window is far too short to capture the genuine variance in the underlying number, and the lines are systematically biased toward recent form rather than role.
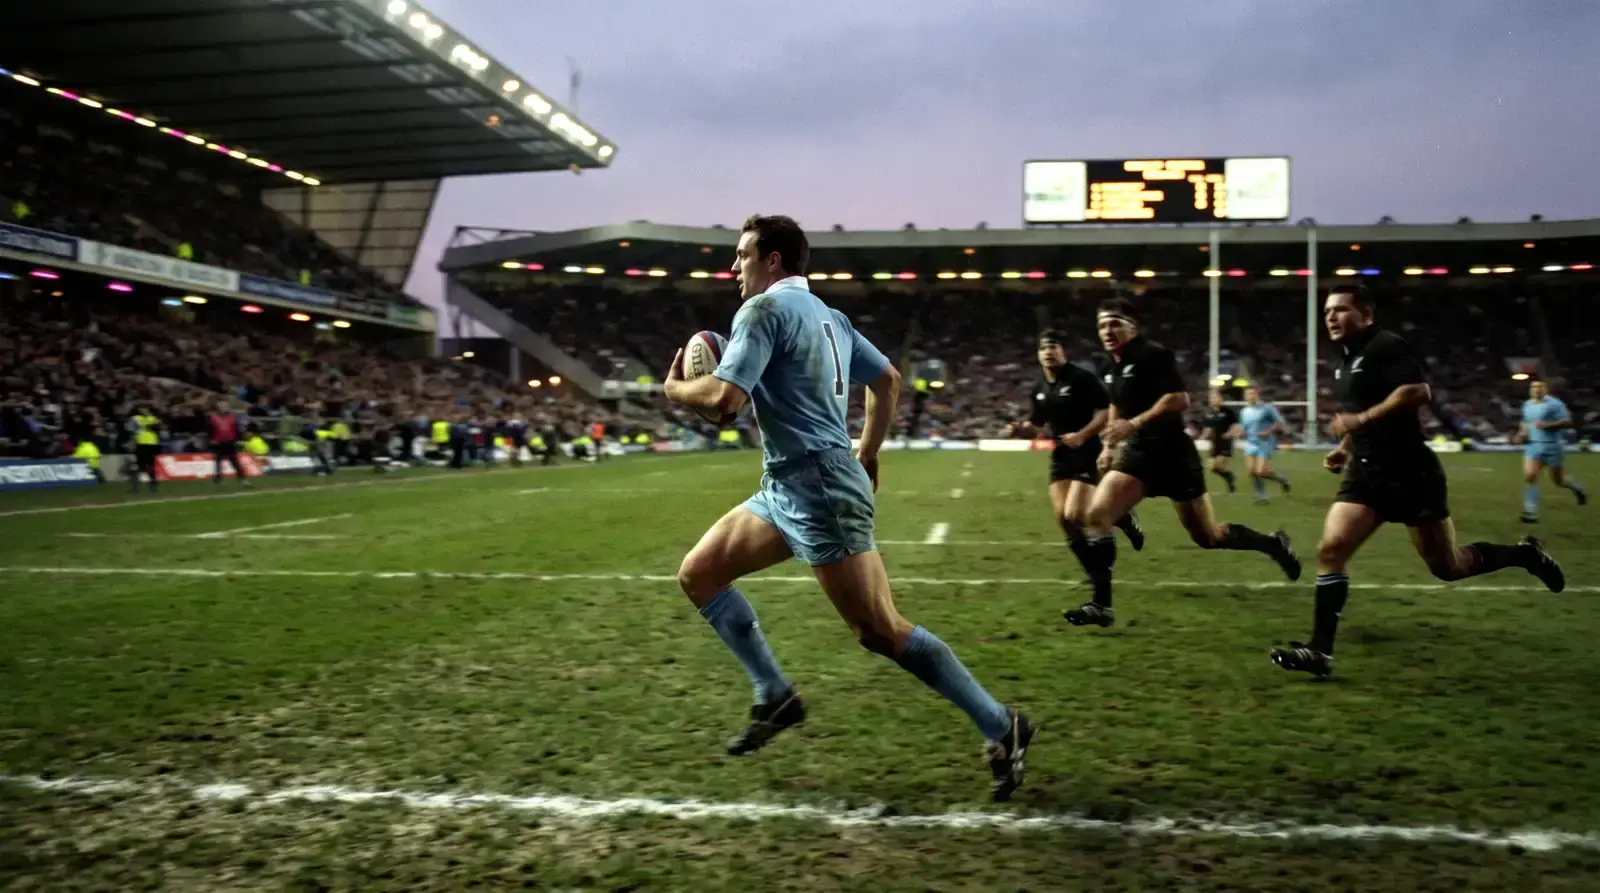
A fullback whose team has played three matches against weak defensive sides will see his run metre line climb dramatically. When that side draws a top defensive opponent the following week, the line stays elevated and the under becomes value. The same dynamic runs in reverse: a fullback returning from injury or sin-binning over the previous fortnight will see his line set artificially low, and the over offers genuine value when his team draws a soft defensive matchup.
Line breaks are a similar story but harder to model, because line breaks themselves are rare events with high statistical variance. A player averaging 1.4 line breaks per match might go three matches without one and then produce four in a single game. Markets that try to price line break props at half-point lines (over/under 1.5, over/under 2.5) almost always offer better value on the under than the over because of how the underlying distribution skews — most players produce zero in most matches.
Tackle markets
Tackle markets are technical, unfashionable, and probably the most underbet line on the NRL prop board. Most casual punters do not stake here, which means liquidity is thin and prices are set defensively — but the underlying numbers are highly predictable, because tackle counts correlate strongly with possession share rather than individual brilliance.
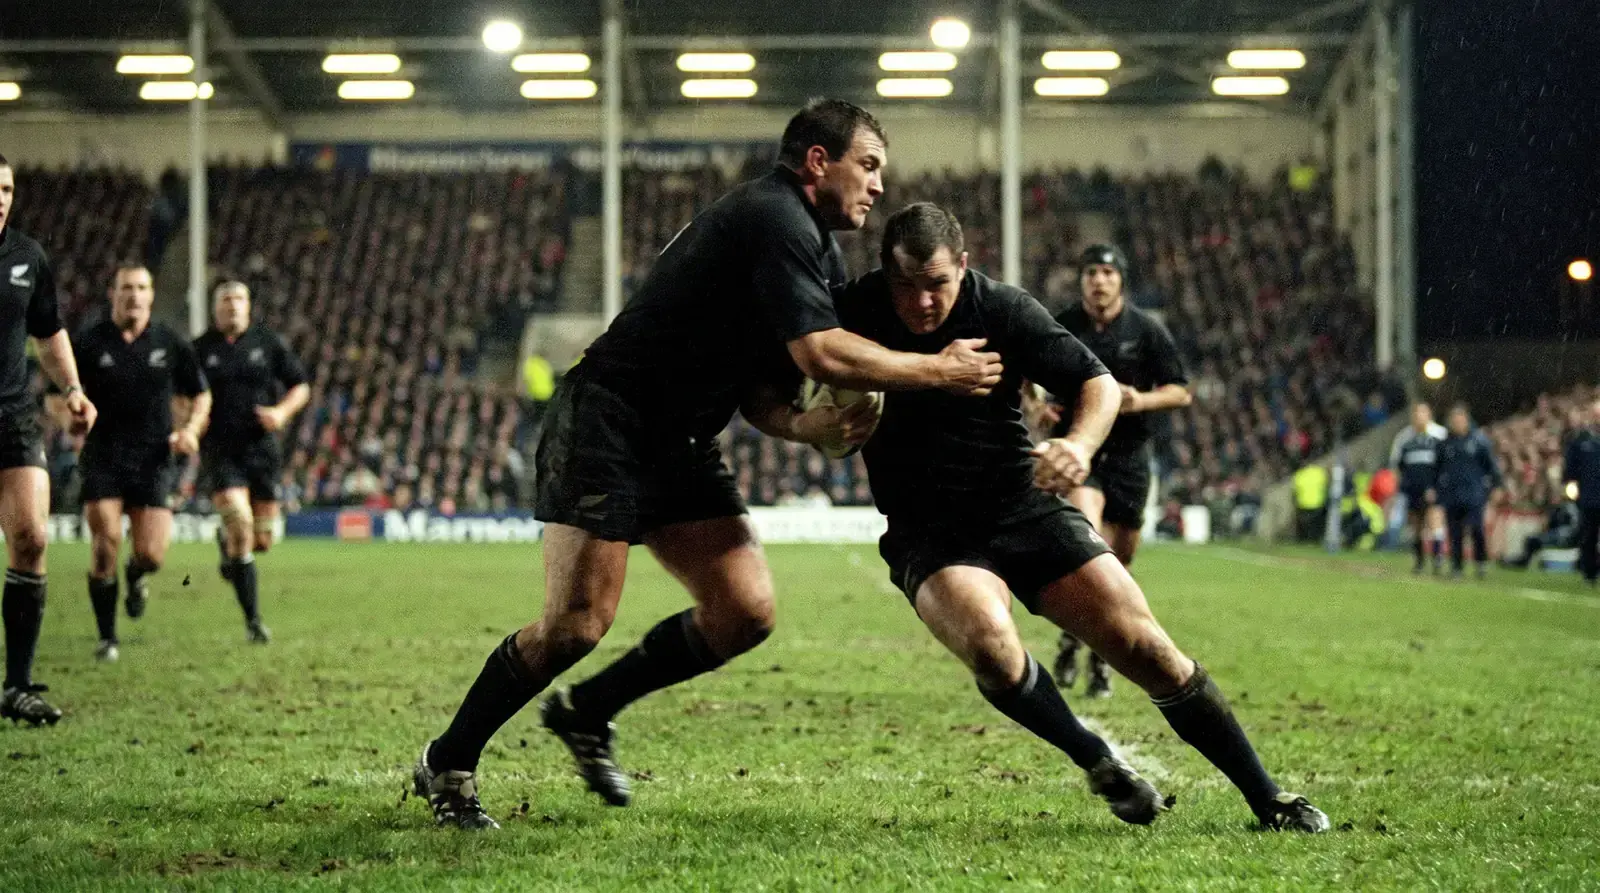
The structural pattern: defensive sides without the ball make more tackles. A middle forward on the underdog in a top-of-table mismatch will routinely make 30-plus tackles because his team spends most of the match defending. The same player on the favourite the following week, with most of the possession, might make twelve. The line tends to move modestly between those scenarios because the bookmaker is averaging across both — and the over on the defensive match becomes a clean bet.
The complication: tackle counts collapse if a player is sin-binned, sent off, or substituted early for injury. NRL tackle props are usually settled at the time of the player leaving the field, which means the over is always exposed to a black-swan early exit. I bet tackle overs only on players with minimal disciplinary risk and stable rotation patterns.
Combo and double markets
Combo markets — try scorer plus winning margin, or anytime scorer in both halves — are designed to look attractive to recreational punters and almost always sit on the wrong side of the value equation. The overround on combos is the sum of overrounds on the component markets, compounded. A try scorer market with 35% overround combined with a winning margin market at 12% overround produces an effective overround above 50%.

That said, there is one combo angle that occasionally offers value: scorer-plus-match-result combinations on heavy favourites where the public is loading the favourite side of the moneyline. The scorer leg is statistically independent of the result leg in most matchups, but the combined market sometimes prices in a discount because the bookmaker is balancing exposure on the favourite. I rarely take these. When I do, the value has to be obvious in both legs independently — never in the combined headline number.
Where the margin actually sits
Reading where the bookmaker is taking the most margin is the single most useful exercise for any NRL props bettor. The pattern is consistent across major Australian operators: try scorer markets carry the highest margin, followed by player prop combos, followed by individual statistical markets like run metres and tackles, with main lines (handicap, totals, moneyline) carrying the thinnest margin.

The current NRL broadcast deal — worth more than AUD 1.7 billion through to 2027 — pulls enormous betting volume into the league, and the operators set their margins to capture as much of that volume as possible. Recreational bettors gravitate to try scorer and combo markets because they are emotionally engaging. Sharp bettors gravitate to run metre and tackle markets because the margins are thinner and the data is more tractable.
NRL CEO Andrew Abdo summarised the league’s commercial position bluntly: more people are watching, more people are playing, and the underlying business is strong. That strength translates to bookmaker confidence in pricing the prop board aggressively. Knowing where the margin sits tells you which markets reward research and which ones charge a premium for the privilege of being on the board.
Building a prop process that survives the season
The bettors I know who actually profit from NRL props over a season do three things consistently. They specialise — they pick one or two prop markets and learn them deeply, rather than spreading bets across the entire board. They line-shop — props vary materially in price between operators, and a 10% better line on a fair bet compounds across a season. And they record everything — strike rate, closing line value, prop type, opponent strength.
For a broader view of NRL season dynamics, particularly how prop value shifts as the finals approach, see my coverage of NRL finals betting patterns.
